Matías Podeley ES

Mining · Exploration & monitoring · Satellite data

Which mining rights cover the area, where to drill, how much rock moved

Four tools: the mining cadastre of seven provinces unified into one map, exploration targets blind-validated against known deposits, excavated volume measured by satellite, and lithium salar buildout year by year.

Email See the cases

What it solves

Four decisions currently made without a map or by paying for a field campaign

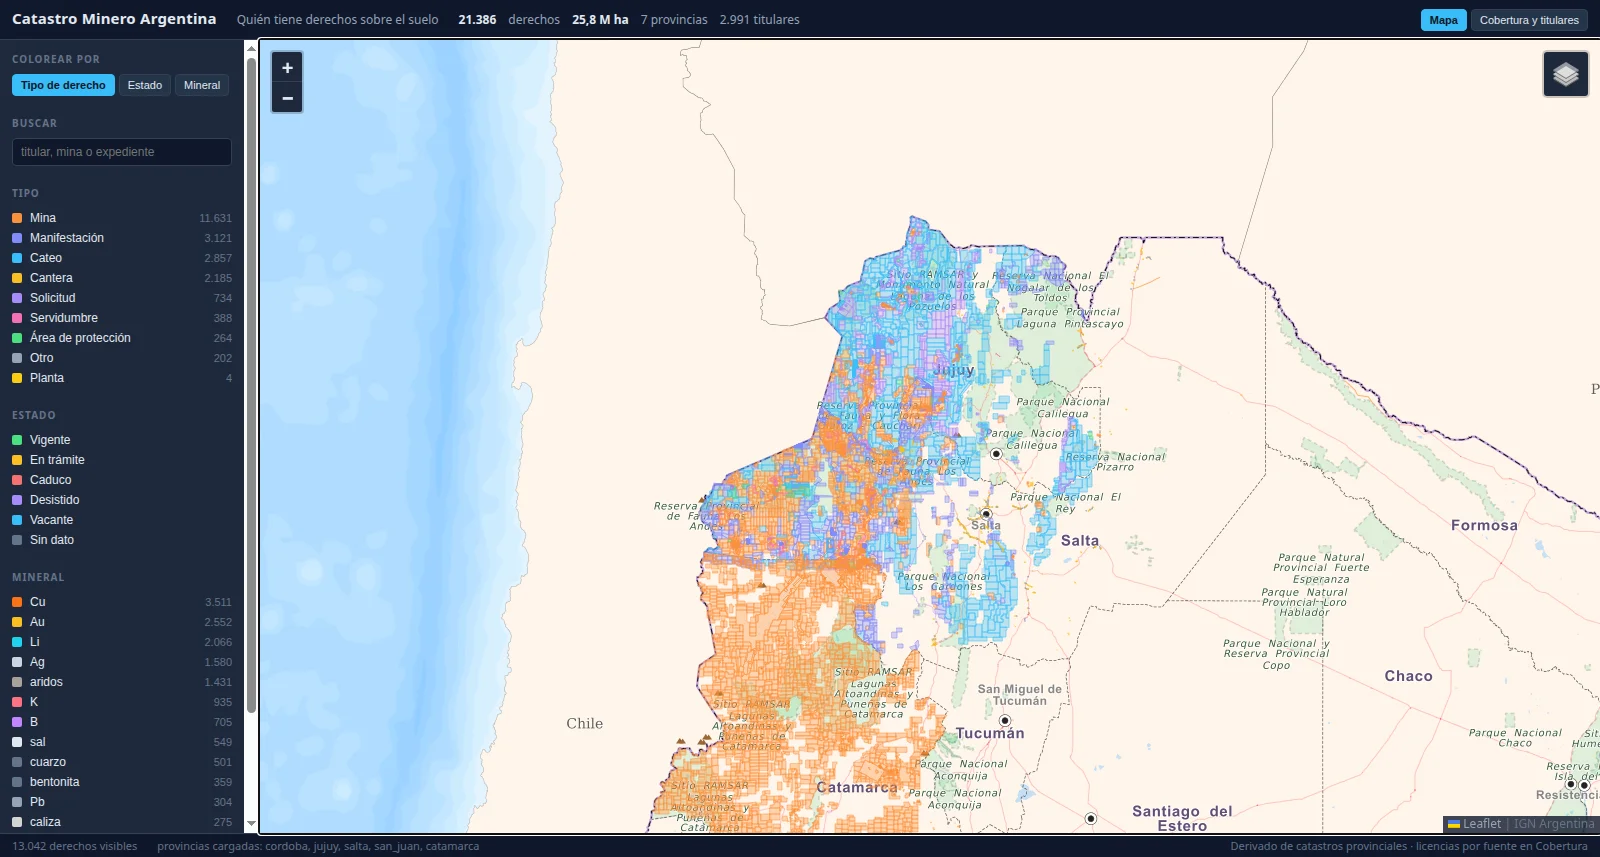
Screenshot: national map of mining tenements by province

The mining rights of seven provinces, unified

Provincial cadastres are published in different formats, coverages and levels of detail. This unifies seven into one map (21,386 tenements, 25.8 million hectares, 2,991 holders), with the mineral and the file number behind every polygon. San Juan has 66.4% of its territory under mining title, and where information is missing the map shows it as explicit absence, never as open ground.

Provincial cadastres · 7 provinces · data to 2026-08 · kept currentOpen dataset

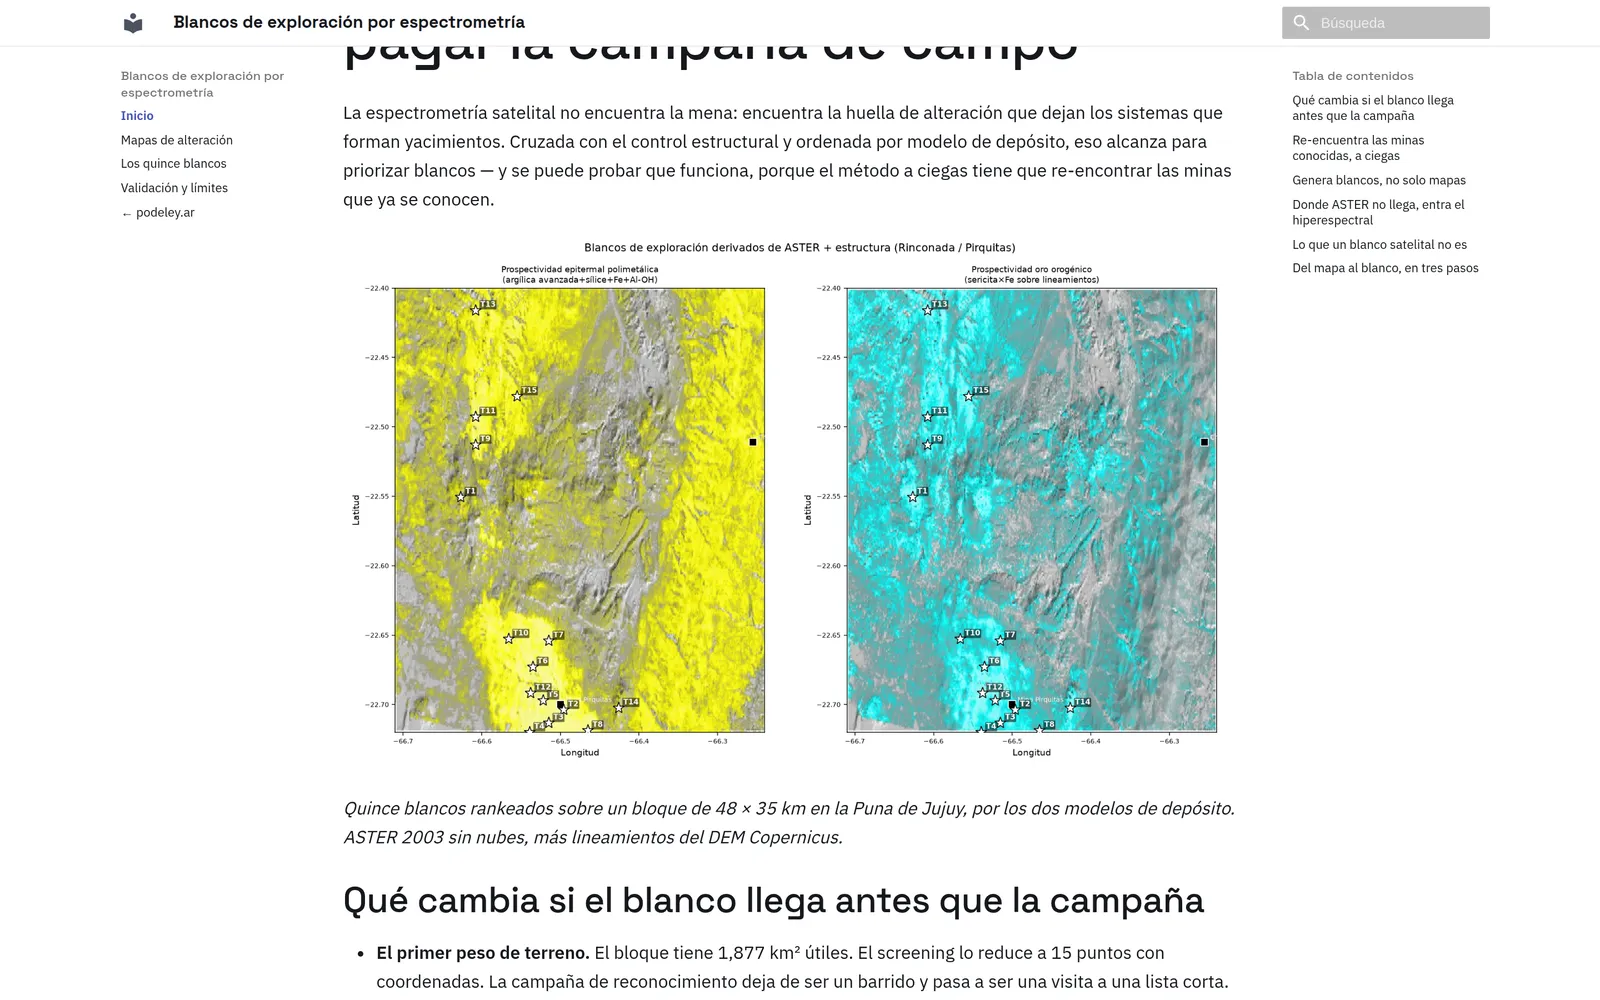
Screenshot: mineral targets from spectrometry

Rank drill targets before paying for the field campaign

The block holds 1,877 km² of usable ground, and screening cuts it to 15 targets with coordinates: reconnaissance stops being a sweep and becomes a visit to a short list. Whether it works is settled blind: the method re-finds Pirquitas and Chinchillas within 20 and 80 meters of the alteration footprint already mapped. The deliverable is shapefile and GeoJSON for your GIS, not a picture.

ASTER + EMIT · 48 × 35 km, Jujuy Puna · 2003 scene · fixed demoPaper

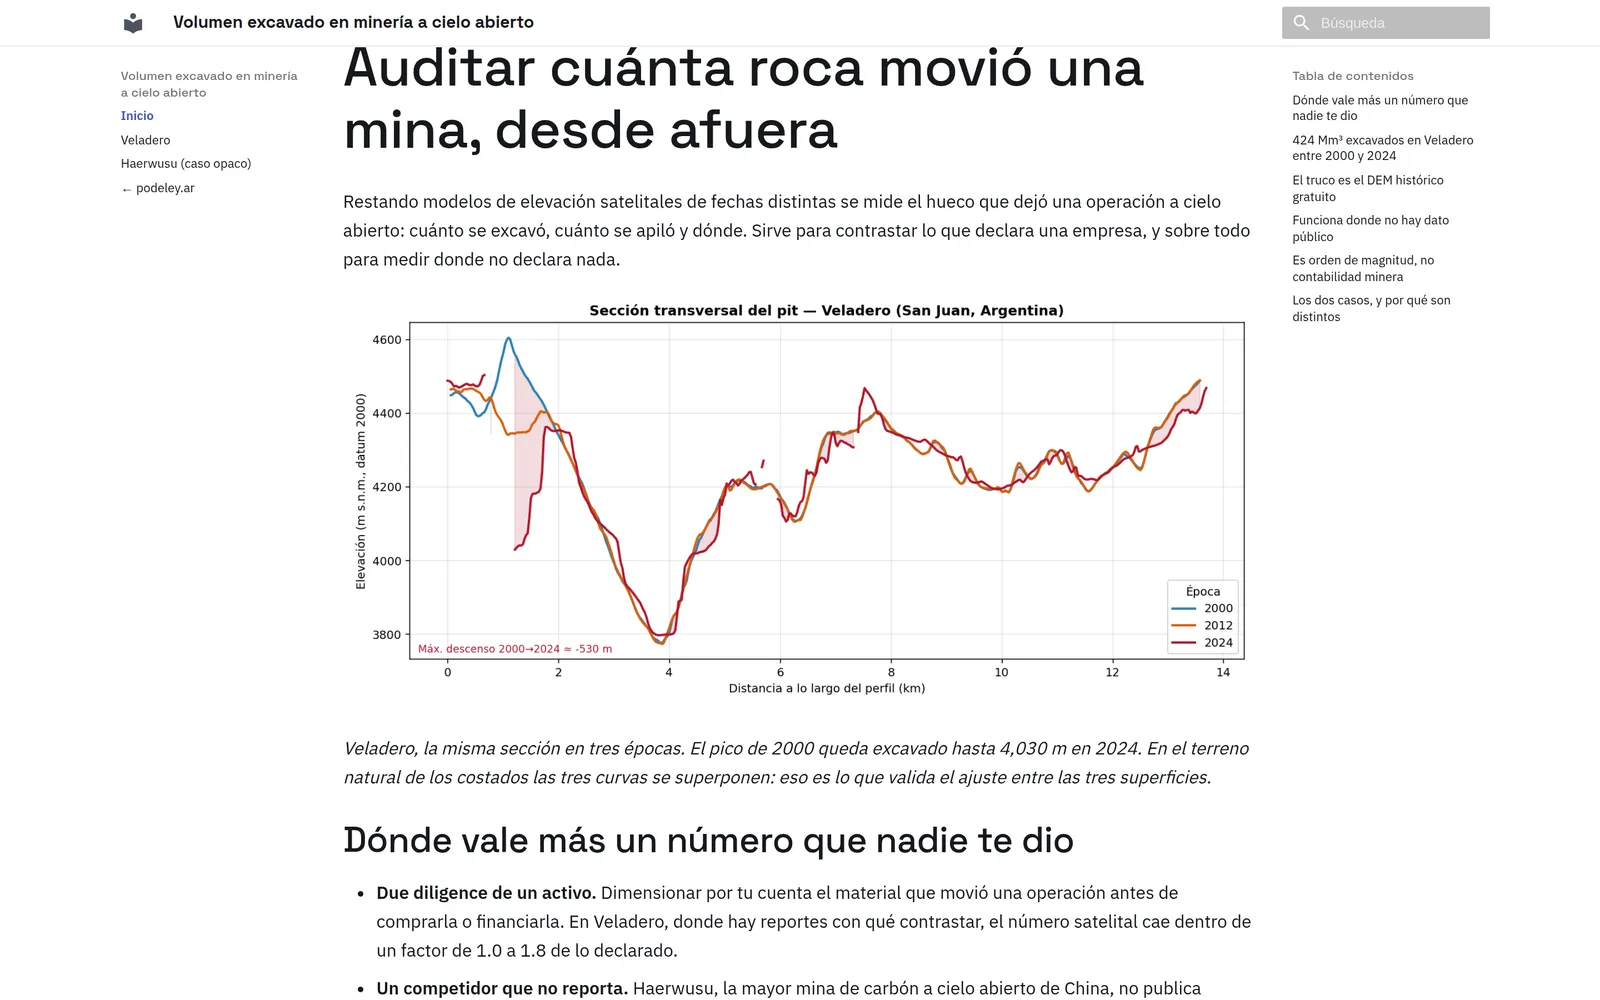
Screenshot: excavated volume from elevation-model differencing

Audit a mine's excavated volume, from the outside

Size up for yourself how much material an operation has moved, before buying into it or financing it. Differencing elevation models from different dates, Veladero gives 424 Mm³ excavated and 497 Mm³ deposited between 2000 and 2024, and there are reports to check that against. At Haerwusu, China's largest open-pit coal mine, no production is declared: the 1,742 Mm³ is an independent measurement where none gets published.

SRTM 2000 + ASTER stereo · Veladero and Haerwusu · data 2000–2024 · fixed demo

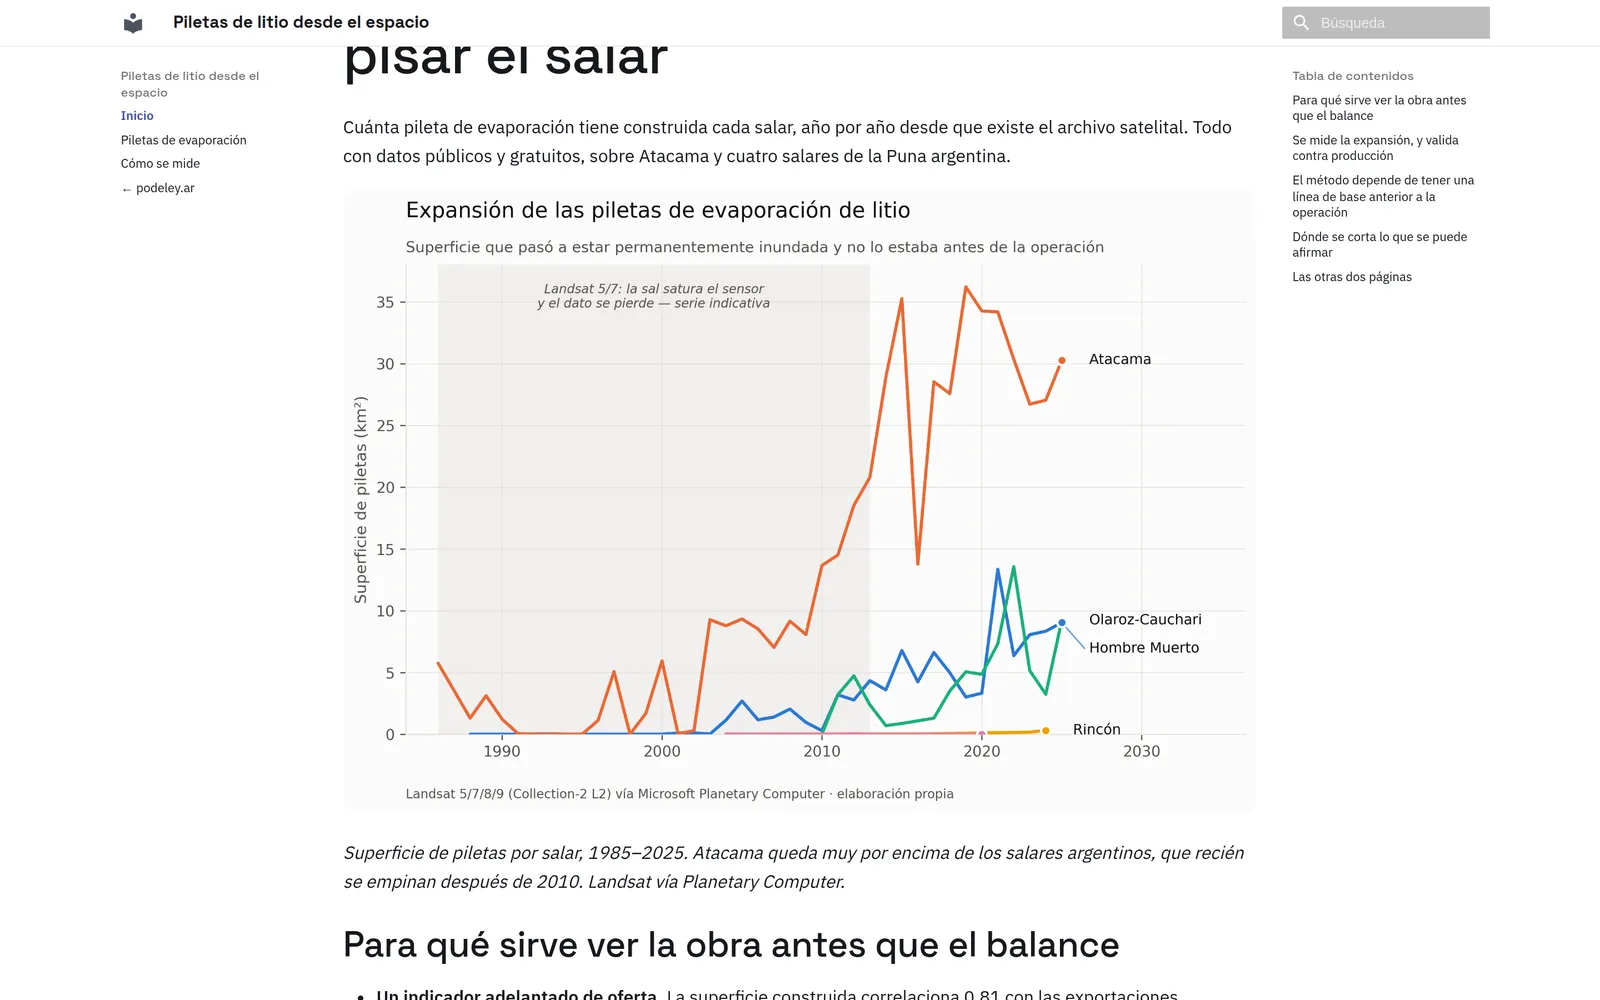
Screenshot: evaporation-pond area by salar, 1985–2025

Each salar's buildout, dated year by year

An announced expansion that arrives without ponds under construction gives itself away: the works are large, visible from orbit and dated year by year. Atacama holds 30.3 km² of ponds against 9.0 at Hombre Muerto, and built area correlates 0.81 with declared exports once you lag it two years, which is how long brine takes to work through the pond chain. Area is not production: direct extraction produces with far fewer ponds.

Landsat · Atacama and 4 Puna salars · data 1985–2025 · fixed demo

Want this over your property or your district? Get in touch

How the work goes

Where to begin

The decision comes first; the satellite after, and only if it earns its place. Everything traces back to open sources your geologist can walk.

Diagnostic

One concrete question about your property: what shows, what doesn't, and with what confidence.

Project

The screening, the map or the monitoring over your ground, layers ready to drop into your GIS.

Advisory

What the satellite can answer and what demands boots on the ground, before the campaign budget closes.

Who's behind this

Matías Podeley. An ITBA engineer, eighteen years in energy: four in operations in Neuquén, simulation of giant fields like Camisea, appraisal of petrochemical projects, technical backing of asset purchases above US$ 300 million, and five years teaching project appraisal. The craft behind this site: understanding the business need, and building the project or the tool that answers it, with AI and auditable sources. Buenos Aires.

Contact

matias@podeley.ar · Buenos Aires